
As the saying goes: “You can’t improve on what you don’t measure,” if you want to scale up your Shopify store, you must stay on top of your Shopify analytics. Lucky for you, Shopify provides you with tons of in-depth reports on all crucial metrics, like gross profit, traffic acquisition, customer lifetime value, and more.
In this article, we will walk you through all you must know about Shopify analytics, including:
- An overview of Shopify analytics;
- What kind of data can you access with Shopify reports and analytics?
Without further ado, let’s dive right in!
An Overview Of Shopify Analytics
What is Shopify analytics?
Shopify analytics comes natively within your admin dashboard. With Shopify analytics, you can track your store performance under many crucial metrics, like acquisition, sales, profit, etc.
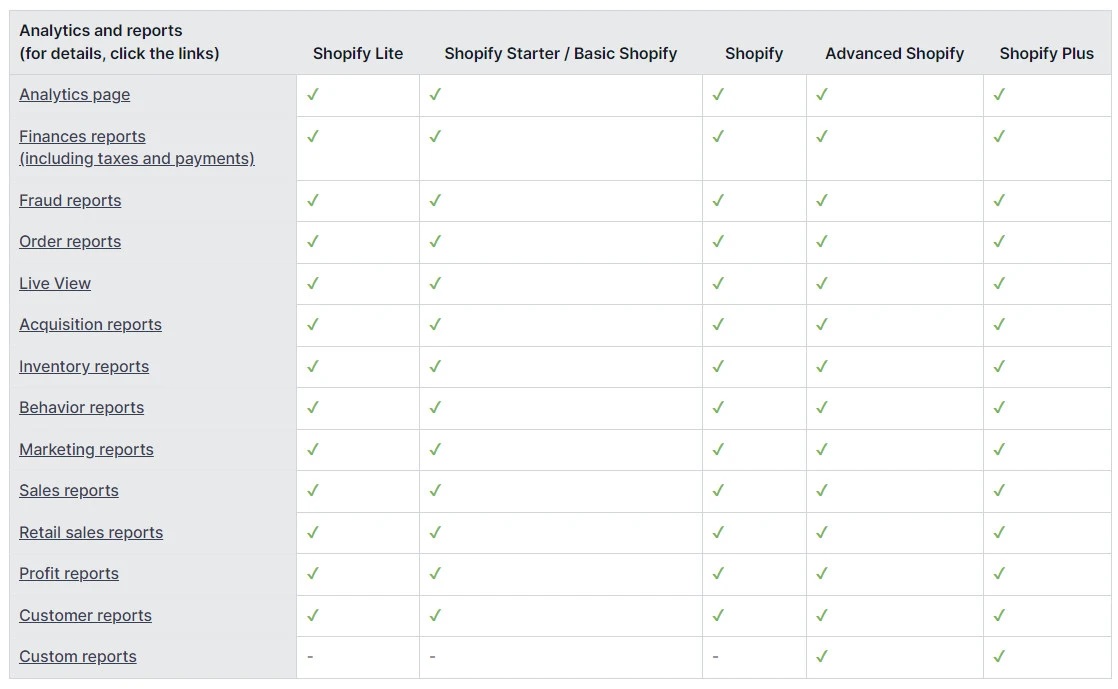
Previously, Shopify analytics was rather limited for stores on lower pricing tiers. Back then, you needed to be on Advanced Shopify to unlock access to important reports like sales, profit, and customers.
However, recently, Shopify has removed this limitation and unlocked access to all reports for merchants of all plans (except for Custom reports– which we’ll discuss later below).
Shopify Analytics vs Google Analytics: Are They The Same?
First things first, Google Analytics and Shopify Analytics both give valuable insights into your store's performance. However, they serve different purposes.
Shopify analytics focuses more on sales-related metrics, like sales, retail sales, orders, customers, etc. Meanwhile, Google Analytics offers a broader range of web analytics like traffic acquisition, pageview, bounce rate, etc.
Below is a table summarizing the differences between Shopify and Google Analytics:
Shopify Analytics | Google Analytics | |
Integration | Directly integrated with your Shopify store. | Requires setup and integration with your store. |
Ease of Use | User-friendly, designed specifically for Shopify. | More complex, offers extensive features beyond eCommerce. |
Data Focus | Primarily focuses on sales, orders, and customer data. | Provides a broader range of web analytics. |
Real-Time Tracking | Offers real-time tracking of sales and customer activity. | Also provides real-time data tracking. |
Customization | Limited customization options. | Highly customizable reports and data views. |
Cost | Included with your Shopify subscription. | Free version available; advanced features may cost extra. |
Together, Shopify analytics and Google Analytics will give you a more complete picture of your store performance. So, don’t miss out on our guide on How to add Google Analytics to Shopify and make smarter decisions.
What Can You Access With Shopify Analytics?
When you sign up for one of Shopify pricing plans, you’ll gain access to an admin dashboard to add products, accept payments, run marketing campaigns, etc. The awesome part is that the platform also gives you detailed analytics to track your store performance.
From our latest research, here are the main Shopify analytics you can access in your Shopify admin dashboard:
#1. Sales performance
Retail sales reports
If you have a brick-and-mortar store, retail sales reports are a must-track Shopify analytics. Shopify retail sales reports will give you insights into products, variants, or staff specific to your POS location.
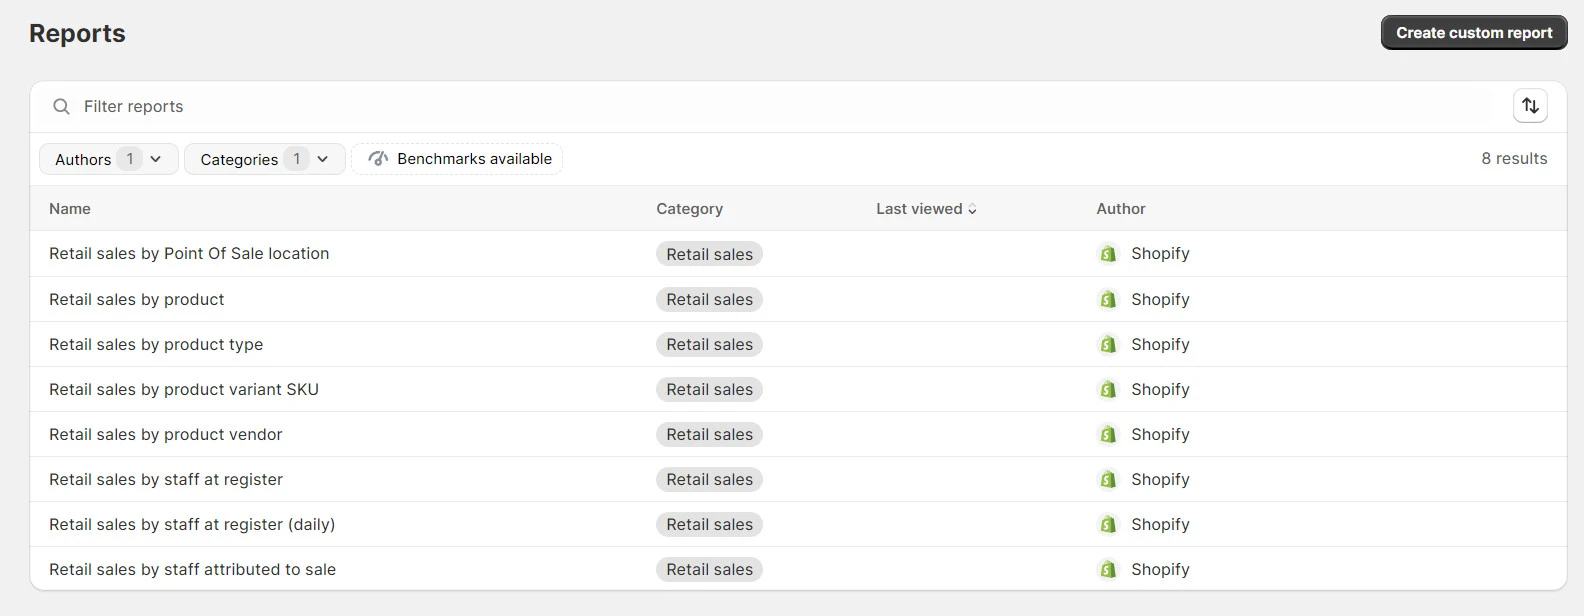
Below are the retail sales metrics you can track with Shopify analytics:
Metric | Purpose |
Retail sales by product | Detail total sales per product, excluding shipping costs. |
Retail sales by product variant SKU | Break down total sales by each product variant, not including shipping. |
Retail sales by product vendor | Compare sales data from each vendor, sorted by POS location. |
Retail sales by product type | Show sales figures for different product types, organized by POS location. |
Retail sales by Point of Sale location | Detail sales from each POS location, highlighting top-performing stores. |
Retail sales by staff at the register | Track sales made by individual staff members. |
Retail sales by staff who helped with sales | Record sales attributed to staff involved in line-item sales at checkout. |
Sales reports
Like retail sales reports, sales reports in Shopify show details about your customers' orders, including the products sold and the sales channels used. In these reports, sales show up as positive numbers on the day they happen, and returns are marked as negative on the day they're processed.
The metrics available within Shopify sale reports are:
Metric | Purpose |
Sales over time | Number of orders and total sales in a specific period. |
Sales by product | Total sales for each product, excluding shipping. |
Sales by product variant SKU | Sales breakdown for each product variant, shipping not included. |
Sales by product vendor | Sales divided by each vendor. |
Sales by discount | Sales categorized by discount names used. |
Sales by traffic referrer | Sales organized by visitor sources, like web pages or ads. |
Sales by billing location | Sales divided by the billing address country/region. |
Sales by checkout currency | Sales breakdown by the currency used, useful for international sales. |
Sales by channel | Sales categorized by channels like Facebook, and POS. |
Sales by customer name | Orders breakdown by customer in a specific period. |
Average order value over time | Record of changes in average order value over time. |
#2. Marketing and acquisition report
Acquisition reports
Shopify acquisition reports reveal valuable insights into how visitors are finding your store. For example, if you see that you're getting a lot of traffic from social media but not many conversions, you may need to focus on creating more targeted ads or improving your landing pages.
With the acquisition report, you have access to three key metrics:
Metric | Purpose |
Sessions over time | This shows the total number of visitors to your store over a chosen period. |
Sessions by referrer | This metric breaks down your visitors by their source, such as organic search, social media, or paid advertising. |
Sessions by location | This report shows you the countries and regions from which your visitors are coming. |
Marketing reports
If you want to run effective marketing campaigns, make sure you keep a close tab on Shopify marketing reports. Marketing reports will give you in-depth insights into which marketing channels work great vs which ones underperform. You can use this data to allocate your budget to the channels that work.
Here are the metrics marketing reports give you:
Metric | Purpose |
Sales attributed to marketing | Show sales linked to your marketing efforts. |
Sessions attributed to marketing | Indicate web traffic from your marketing campaigns. |
Conversion by the first interaction | Reveal orders and average value from first-time site visitors, helping you identify effective referrals. |
Conversion by last interaction | Display orders from users who haven't returned post-purchase. |
Attribution model comparison | Compare first and last interaction data to identify customer retention trends. |
#3. Customer and behavior report
Customers reports
If you want to understand your customers better and tailor your marketing efforts to match them, Shopify customer reports can come in handy. You can track and monitor important customer data like the number of new and returning customers, where they're from, etc.
Here are the metrics available within Shopify customer reports:
Metric | Purpose |
Customers over time | Display the number of customers who placed orders during a chosen time frame. |
First-time vs returning customer sales | Compare order values between new customers and those who have shopped before. |
Customers by location | Provide data on orders and spending by customers from specific areas. |
Returning customers | Detail on customers who have made two or more orders. |
One-time customers | Information on customers with only a single purchase. |
At-risk customers | Data on returning customers who haven't made recent purchases. |
Loyal customers | Information on customers who frequently buy from your store. |
Behavior reports
Shopify behavior reports in Shopify Analytics give you simple insights about what your customers do on your site, which helps in making your promotions and upselling better.
Here's a quick look at what these reports show:
Metric | Purpose |
Online store conversion over time | The rate of visitors buying things on the total impressions in a selected time range. |
Online store speed | How fast your store loads compared to others. |
Top online store searches | What people search for in your store, including searches that show no results. |
Product recommendation conversions over time | If your suggested products lead to sales. |
Sessions by landing page | The first pages customers see when they land at your store. |
Sessions by device | What devices do customers use to visit your store? |
Online store cart analysis | Common product combos in carts are great for planning bundles and upselling. |
#4. Operation analytics
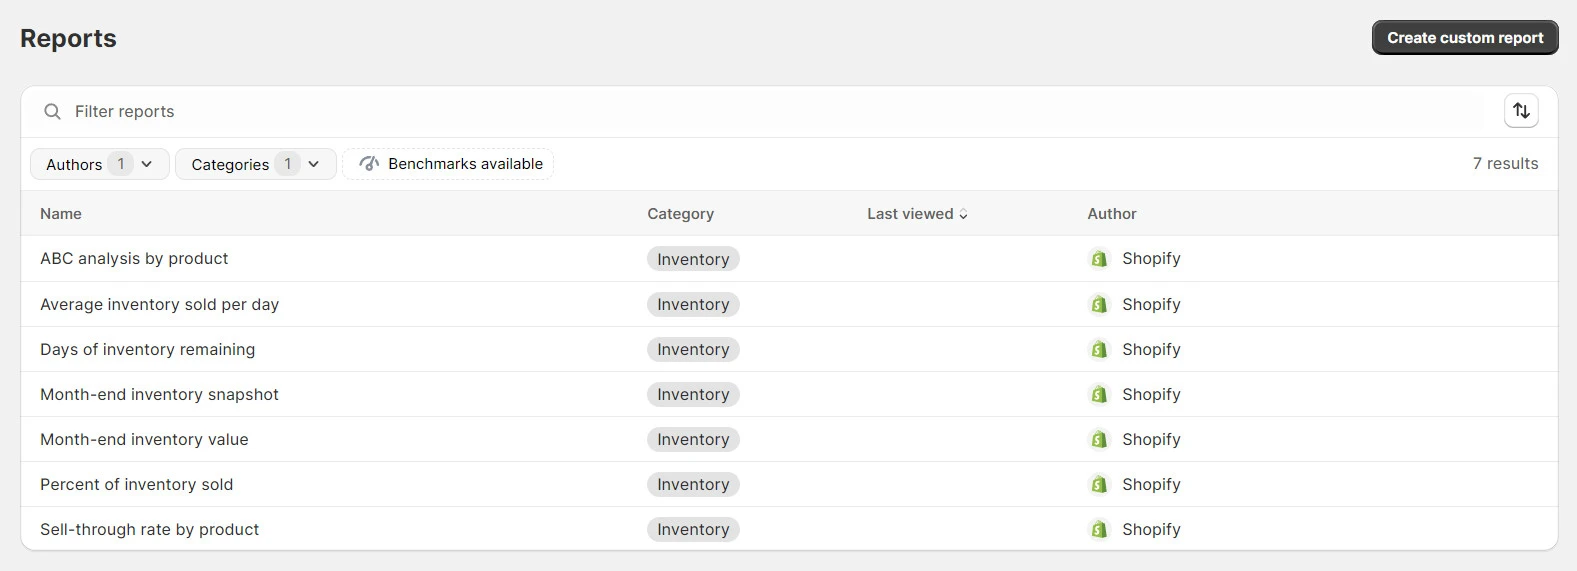
Inventory reports
If you want to manage your inventory effectively, Shopify inventory reports will come in handy. The reports will give you a snapshot of your inventory at month's end, allowing you to predict which items to stock and when to stock them.
Here are the inventory-related metrics you can track within your Shopify analytics dashboard:
Metric | Purpose |
Month-end inventory snapshot | The quantity of each product variant available at month's end. |
Average inventory sold per day | Daily sales average of each product variant. |
Percentage of inventory sold | Percentage of each product variant sold over a customizable period. |
ABC analysis by product | Ranks product variants based on their sales contribution. |
Product sell-through rate | Percentage of total inventory sold in a chosen period. |
Days of inventory remaining | Estimates how long current stock will last based on past sales. |
Order reports
Shopify order reports are key for gauging customer satisfaction and identifying issues with products, such as design flaws or quality problems, especially if certain items are returned more frequently.
Some key order reports within Shopify analytics include:
Metric | Purpose |
Orders over time | Track the number of orders delivered in a specific period. |
Fulfillment, shipping, and delivery times | Measure the time from order placement to delivery. |
Fulfillment over time | Show the total orders fulfilled or shipped in a chosen timeframe. |
Profit reports
High revenue doesn’t translate into high profits. That makes profit reports among the most important Shopify analytics you should closely monitor. Shopify profit analytics will give you information on your profit by product, SKU, location, and more. And you can thereby focus on promoting products with higher profit margins.
Here are the profit metrics you can access with Shopify analytics:
Metric | Purpose |
Profit by product | Display total profit per product for a chosen period. |
Profit by product variant SKU | Show profit for specific product variants within a selected timeframe. |
Profit by Point of Sale location | Reveal gross profit by each point-of-sale location, which is especially useful for retailers with multiple physical stores. |
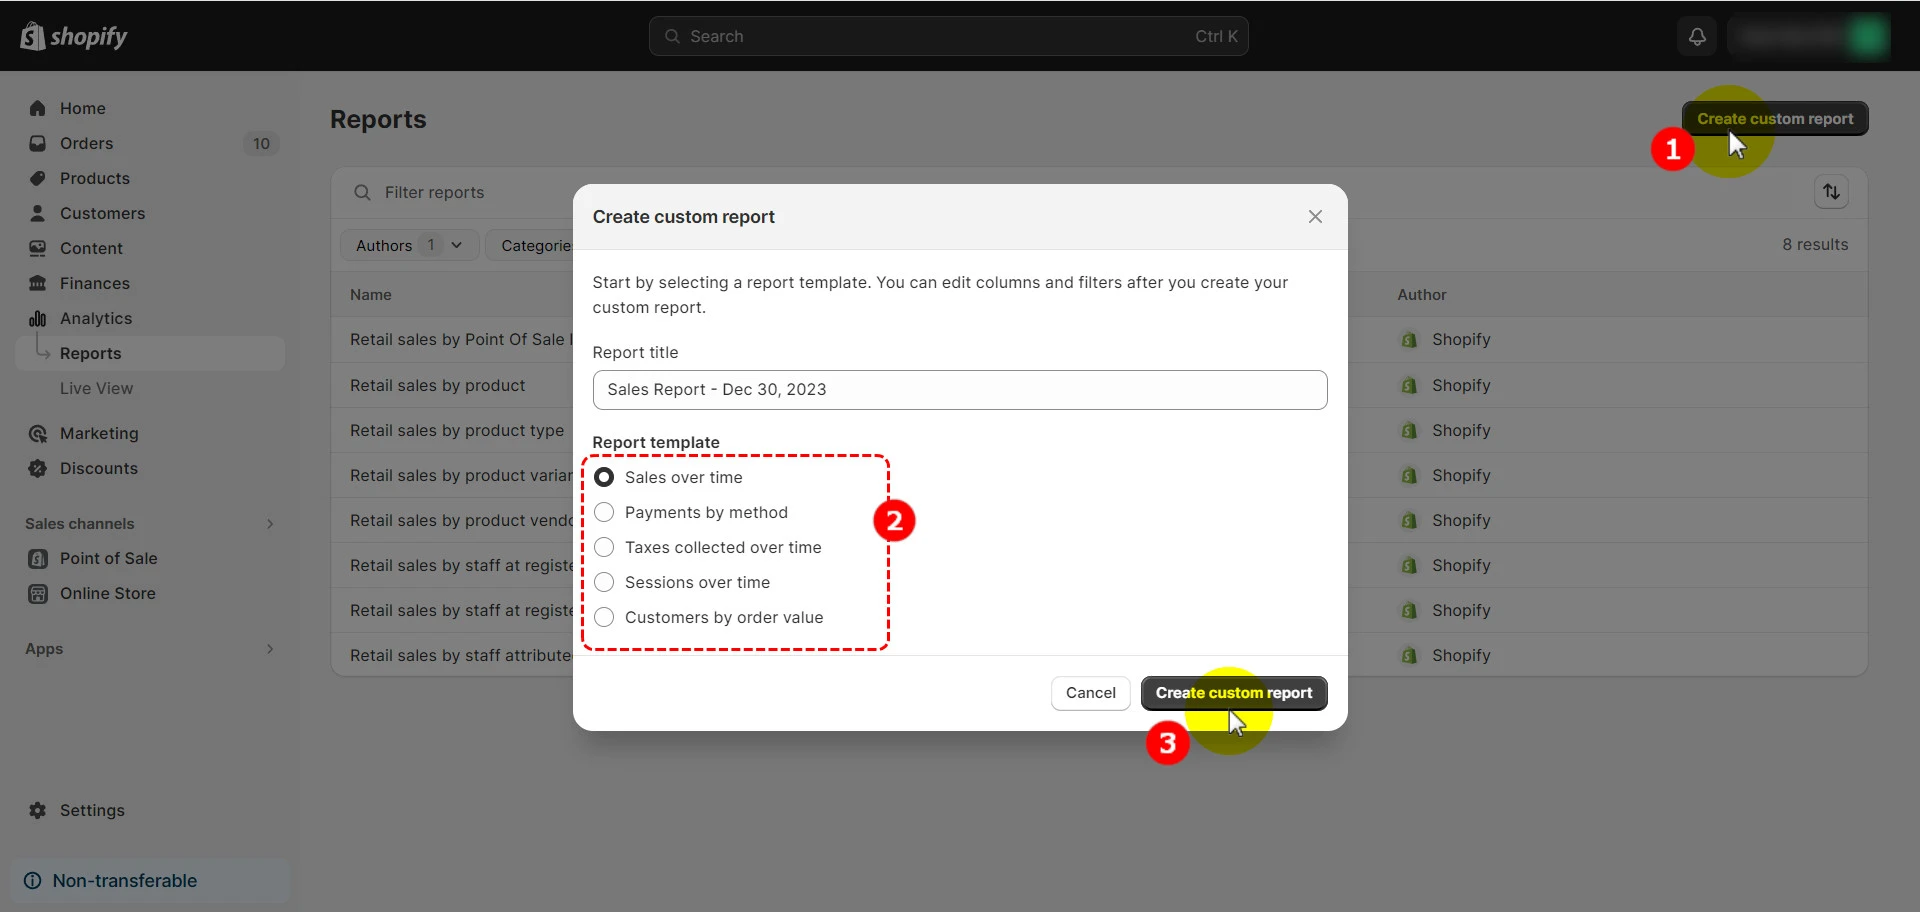
#5. Custom reports
If you are an Advanced Shopify or Shopify Plus user, you are allowed to create your custom reports as well.
You can personalize default reports by filtering and editing them to focus on specific data important to your store. For instance, if you run a marketing campaign across various platforms like Twitter, Facebook, and Google ads, custom reports can break down data by each channel.
To create a custom report, head to Analytics > Reports in your Shopify dashboard and select ‘Create custom report‘. Then select your report template and click ‘Create custom report’.
Frequently Asked Questions
How do I view Shopify analytics?
Access Shopify Analytics from your Shopify admin dashboard. Navigate to the 'Analytics' section to view various reports and data.
Is Shopify Analytics the same as Google Analytics?
No, Shopify Analytics is different from Google Analytics. Shopify Analytics is more focused on e-commerce metrics, while Google Analytics offers broader web analytics.
How do I see store stats on Shopify?
To view store stats, go to the Shopify admin dashboard, click on 'Analytics', and then select 'Dashboard' to see an overview of your store's stats.
Final Thoughts
In brief, to boost your Shopify store’s overall performance, you need to make data-backed decisions. We hope after reading this article, you can have a better understanding of Shopify analytics and make the best out of them for your sake.
Don’t forget to check out LitExtension’s blog and join our active Facebook Community to get the latest eCommerce news, trends, tips, and hacks.