Running an online store without tracking the right numbers is like sailing without a compass. You may move forward, but you won’t know if you're heading in the right direction. That’s why eCommerce metrics are essential for any business that wants to grow sustainably.
In this guide, we’ll walk you through everything you need to know about eCommerce metrics, what they are, how they work, and why they matter. Then, we'll explore the top 20+ key eCommerce metrics you should know about, including:
- Total revenue
- Sales conversion rate
- Micro to macro conversion rates.
- Average order value
- Revenue by channel
- Shopping cart abandonment rate
- Average inventory sold per day
- Refund and return rate
- Customer lifetime value
- Customer acquisition costs
- Returning customer rate
- Customer retention rate
- Churn rate
- Net promoter score
- Total traffic
- Impression
- Engagement
- Click-through rate
- Email subscription rate
- Return on ad spend (ROAS)
- Bounce rate
Let's get started!
eCommerce Metrics – All You Need to Know
Before we dive into the list of essential eCommerce metrics, it’s important to understand the basics. This section will explain what eCommerce metrics are, how they differ from KPIs, and why they play a key role in the success of your online store. You'll also learn how often you should analyze these metrics to stay on top of your store’s performance. By getting a clear grasp of these fundamentals, you’ll be better prepared to track what truly matters and make informed decisions for your business.
What are eCommerce metrics?
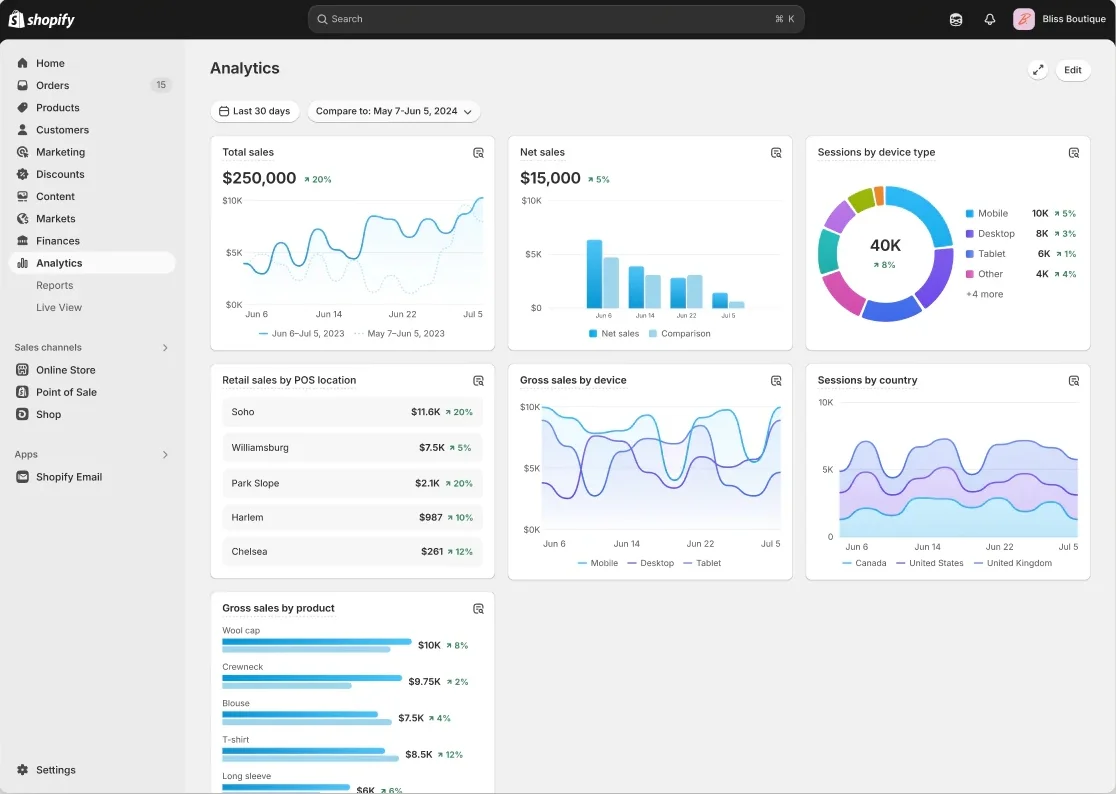
eCommerce metrics are measurable values that show how well your online store is performing. These numbers give you insights into different areas of your business, such as sales, customer behavior, marketing efforts, and website performance.
For example, metrics like total revenue, conversion rate, and average order value help you understand how much you’re selling and how effectively your store turns visitors into customers. On the other hand, metrics like bounce rate or return on ad spend show how well your marketing campaigns are working.
By tracking the right eCommerce metrics, you can make better decisions, fix problems early, and grow your store with confidence. These metrics act as a guide to help you improve your strategy, adjust your goals, and stay on the path to long-term success.
eCommerce metrics vs KPI: What are the differences?
Although the terms eCommerce metrics and KPIs (Key Performance Indicators) are often used together, they are not exactly the same. Both help you measure performance, but they serve different purposes in your business strategy.
eCommerce metrics refer to any data point you can track, such as traffic, bounce rate, or average order value. These numbers give you a broad view of how your store is doing in specific areas. You can track dozens of metrics across sales, marketing, customer service, and operations.
KPIs, on the other hand, are the specific metrics you choose to focus on because they reflect your business goals. For example, if your goal is to increase customer loyalty, your KPI might be the returning customer rate. If you aim to improve profitability, your KPI could be customer lifetime value (CLV).
In short, all KPIs are metrics, but not all metrics are KPIs. Metrics show what’s happening, while KPIs help you measure what matters most. By understanding the difference, you can avoid information overload and focus on tracking the numbers that truly support your business objectives.
The importance of eCommerce metrics to your business
Tracking eCommerce metrics is one of the most effective ways to understand and grow your online business. These numbers provide clear, measurable insights into how well your store is performing in key areas such as sales, marketing, customer satisfaction, and operations. Here are the key reasons why these metrics matter for your business:
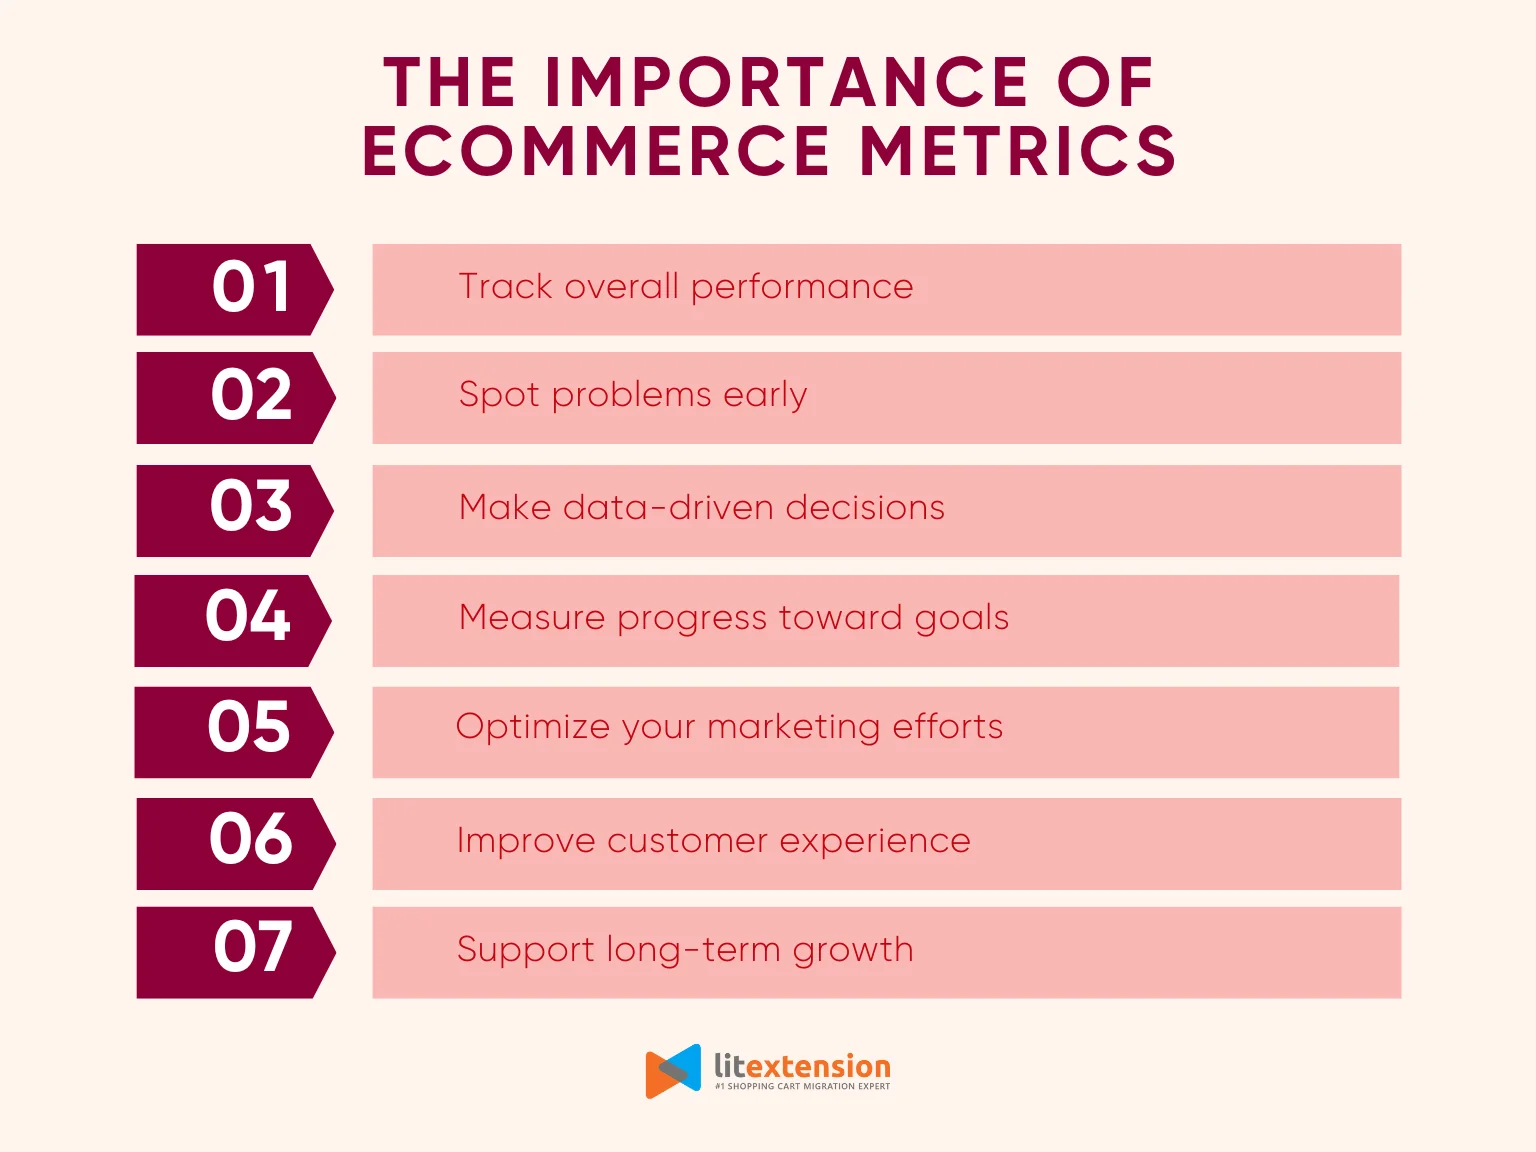
- Track overall performance: Metrics give you a clear view of how your store is doing in areas like sales, marketing, and customer satisfaction.
- Spot problems early: By monitoring changes in key numbers, you can catch issues, like rising bounce rates or falling conversion rates, before they impact your revenue.
- Make data-driven decisions: Instead of guessing, you can use real numbers to decide where to invest, what to fix, and how to improve your store.
- Measure progress toward goals: Metrics help you see how close you are to reaching specific targets, such as higher revenue or better customer retention.
- Optimize your marketing efforts: With the right data, you can identify your most effective channels, refine ad campaigns, and improve your return on investment (ROI).
- Improve customer experience: Metrics like return rate or NPS show how satisfied your customers are, giving you a chance to make their experience better.
- Support long-term growth: Regularly tracking eCommerce metrics helps you understand what works, so you can build on your strengths and scale your business efficiently.
With the right data in hand, you can optimize every part of your store and drive long-term success.
How often should you analyze eCommerce metrics?
There’s no one-size-fits-all answer, but the frequency of analyzing eCommerce metrics depends on the type of metric and your business goals. Some metrics need daily attention, while others are better reviewed weekly or monthly.
Here’s a breakdown to help you stay on track:
- Daily: Review sales, website traffic, conversion rate, and ad spend. These metrics help you react quickly to changes or issues in performance.
- Weekly: Monitor cart abandonment, bounce rate, top-selling products, and marketing performance. Weekly reviews help you spot short-term trends and adjust your campaigns or offers.
- Monthly: Analyze customer retention, average order value, return rate, and customer lifetime value. These eCommerce metrics give you a broader view of business health and customer behavior.
- Quarterly: Evaluate long-term KPIs like customer acquisition cost, churn rate, and ROI from marketing strategies. These help you assess strategy and plan future growth.
By setting a regular review schedule, you can make better decisions, stay aligned with your goals, and respond to issues before they affect your bottom line.
20+ Important eCommerce Metrics to Track
Now that you understand what eCommerce metrics are and why they matter, it’s time to explore the specific metrics that can help you grow your online store. In this section, we’ll break down more than 20 important metrics into three key categories: sales, customer acquisition and retention, and digital marketing.
For each metric, you’ll find a clear explanation of what it means, why it’s important, and how to calculate it. This will help you track the right numbers, make better decisions, and focus on what truly drives your business forward.
Sales metrics
1. Total revenue
Total revenue is the complete amount of money your store earns from sales before subtracting any costs or expenses. It includes income from all orders, regardless of payment method, channel, or customer type.
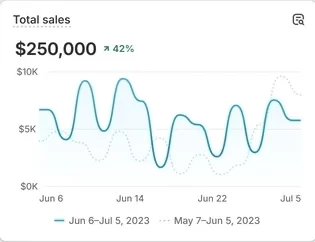
This metric gives you a clear picture of your store’s overall performance. It helps you measure growth over time and compare your results across different periods, such as daily, weekly, or monthly. In addition, total revenue serves as a foundation for analyzing other important eCommerce metrics like profit, average order value, and customer lifetime value, making it essential for understanding the financial health of your business.
Here's how you can calculate total revenue:
Total Revenue = Number of Orders × Average Order Value
2. Sales conversion rate
Sales conversion rate measures the percentage of visitors to your online store who complete a purchase. It shows how effective your store is at turning traffic into paying customers.
Sales conversion rate is one of the most important eCommerce metrics because it directly reflects how well your website performs. A high conversion rate means your product pages, checkout process, and user experience are working well. On the other hand, a low rate could signal issues like slow page load, unclear calls-to-action, or poor product presentation. By monitoring this metric regularly, you can test improvements and increase your revenue without needing more traffic.
Here's how you can calculate the sales conversion rate:
Sales Conversion Rate = (Number of Orders / Number of Visitors) × 100
3. Micro to macro conversion rates
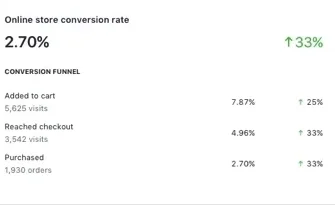
Micro to macro conversion rates track the percentage of users who complete smaller actions (micro conversions) that lead up to a final purchase (macro conversion). Micro conversions can include actions like viewing a product, adding to cart, or signing up for a newsletter, while the macro conversion is typically the completed order.
This metric helps you understand how visitors move through your sales funnel. By tracking each step, you can pinpoint where users drop off and identify which stages need improvement. For example, if many users add items to their cart but don’t check out, the issue may be with shipping costs or the checkout process. By improving micro conversion points, you can increase your overall sales without needing more traffic.
To measure the micro to macro conversion rates, you can follow this formula:
Step Conversion Rate = (Number of Users Who Completed the Step / Number of Users Who Reached the Previous Step) × 100
4. Average order value
Average Order Value (AOV) is the average amount of money a customer spends in a single transaction on your online store. It reflects how much customers typically buy each time they place an order.
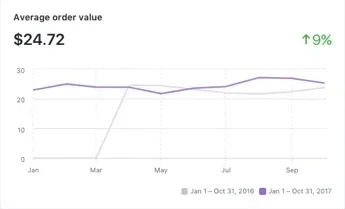
A higher AOV means you’re generating more revenue from each customer without increasing traffic or acquisition costs. This eCommerce metric is especially useful when planning marketing campaigns, setting free shipping thresholds, or designing upsell and cross-sell strategies. Tracking AOV helps you focus on increasing the value of each sale, which can significantly boost profitability over time.
You can calculate Average Order Value using the following formula:
Average Order Value = Total Revenue / Number of Orders
5. Revenue by channel
Revenue by channel refers to the total amount of money your store earns from each traffic source, such as organic search, paid ads, email, social media, or direct visits. It helps you break down your sales performance by where your customers came from.
By knowing which channels drive the most revenue, you can invest your time and budget more effectively. For instance, if paid ads generate high revenue but low profit due to high costs, you might consider shifting focus to organic or referral traffic. This metric also helps you compare performance across marketing campaigns and optimize your channel mix for better ROI.
To calculate how much revenue each channel contributes to your overall sales, you can use the following formula:
Revenue by Channel = (Total Revenue from a Specific Channel / Total Revenue) × 100
6. Shopping cart abandonment rate
Shopping cart abandonment rate measures the percentage of users who add items to their cart but leave the site without completing a purchase. It highlights how many potential buyers drop off at the final step of the customer journey.
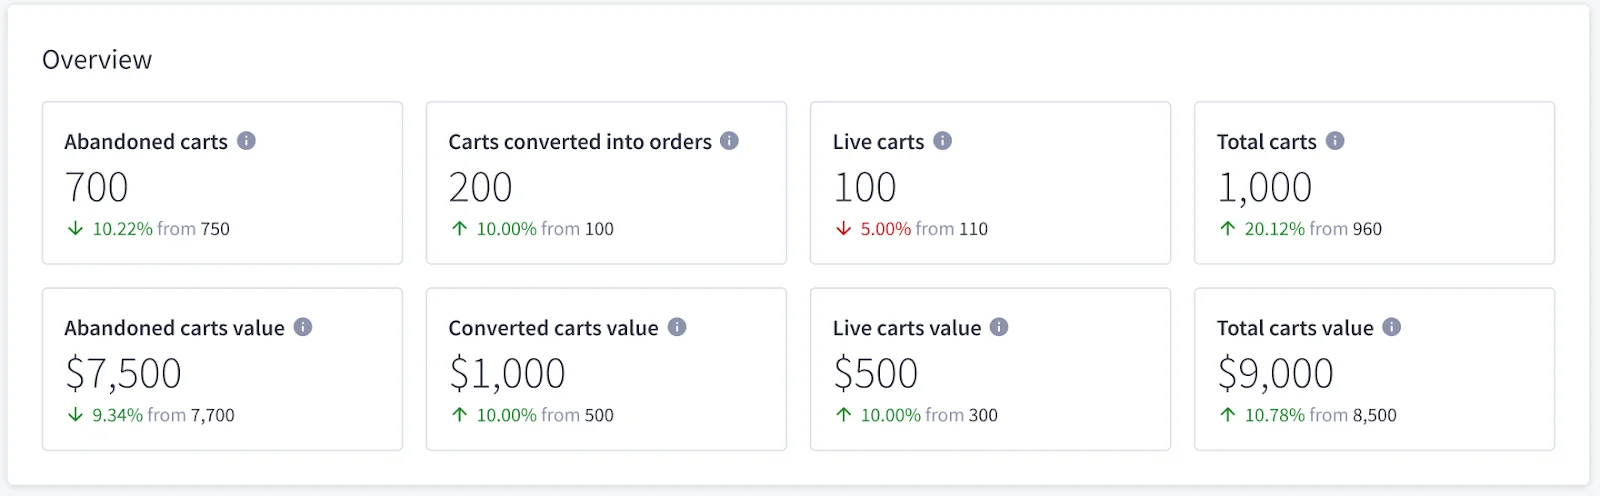
This metric shows you how much revenue you’re missing out on and helps uncover issues in the checkout process. A high abandonment rate may point to unexpected shipping fees, long forms, lack of payment options, or even slow page load times. By identifying and fixing these problems, you can recover lost sales and improve your overall conversion rate. Therefore, it's one of the most valuable eCommerce metrics to track regularly, especially if your store gets a lot of traffic but not enough sales.
To calculate the shopping cart abandonment rate, use the following formula:
Shopping Cart Abandonment Rate = (1 - Completed Orders / Shopping Carts Created) × 100
7. Average inventory sold per day
Among practical eCommerce metrics, this one plays a key role in optimizing operations and keeping your store running smoothly. It measures the average number of units sold each day over a specific period, giving you insight into your sales pace and helping you understand product demand on a daily level.
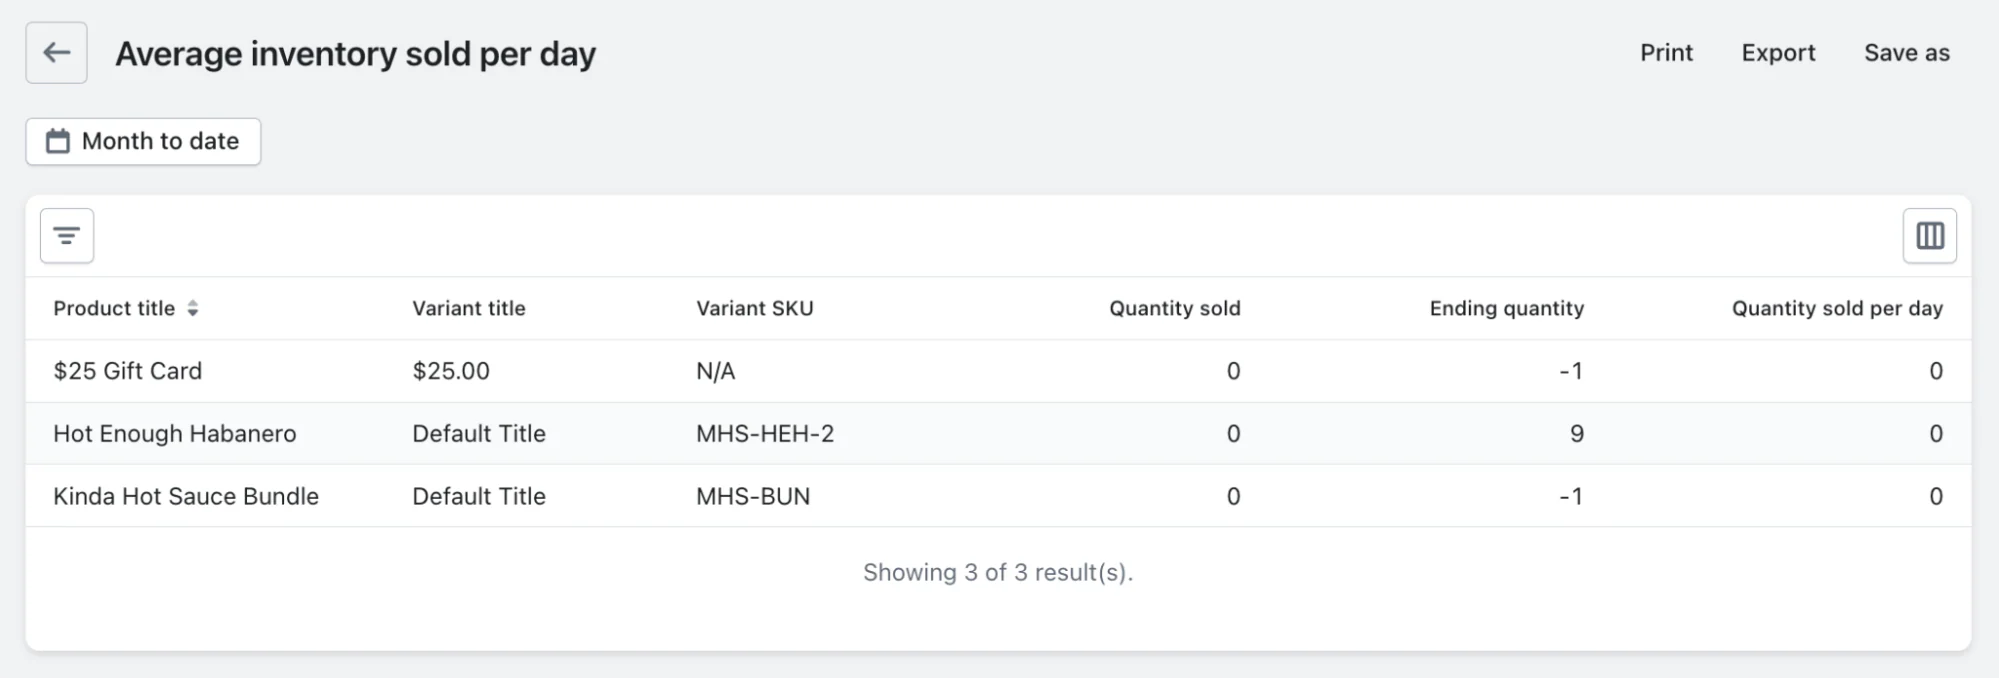
Knowing how many units you sell each day allows you to plan inventory restocking more accurately. It helps prevent both excess inventory that ties up capital and stockouts that lead to missed sales. This metric is especially useful for forecasting and managing fast-moving or seasonal products.
You can calculate the average inventory sold per day using this formula:
Average Inventory Sold per Day = Total Units Sold / Number of Days in the Period
8. Refund and return rate
Refund and return rate refers to the percentage of orders that customers send back or request refunds for after purchasing. This includes products returned due to dissatisfaction, damage, wrong sizing, or other issues.
As one of the most important post-purchase eCommerce metrics, this figure reveals how well your products meet customer expectations and how much revenue is being lost. A high return rate can hurt your profit margins, affect inventory planning, and indicate problems with product quality, descriptions, or customer expectations. Tracking this metric helps you identify which products have the highest return rates and take steps to improve them.
To calculate the refund and return rate, use the following formula:
Refund and Return Rate = (Number of Returned or Refunded Orders / Total Orders) × 100
Customer acquisition and retention metrics
9. Customer lifetime value
Customer Lifetime Value (CLV) is the total amount of money a customer is expected to spend in your store throughout their entire relationship with your brand. It reflects the long-term value of keeping a customer, rather than focusing only on one-time purchases.
Among strategic eCommerce metrics, CLV is key for building sustainable growth and making smarter marketing and retention decisions. It helps you decide how much you should spend to acquire new customers and how to better invest in keeping existing ones. A higher CLV means more profit per customer, allowing you to grow without constantly increasing acquisition costs. This statistic is also useful for shaping loyalty programs, email marketing, and personalized offers.
To calculate customer lifetime value, you can use this formula:
Customer Lifetime Value = Average Order Value × Purchase Frequency × Customer Lifespan
10. Customer acquisition costs
Customer Acquisition Cost (CAC) refers to the average amount of money spent on marketing and sales to acquire one new customer. It includes costs like paid ads, email campaigns, influencer partnerships, and any tools or services used to attract buyers.
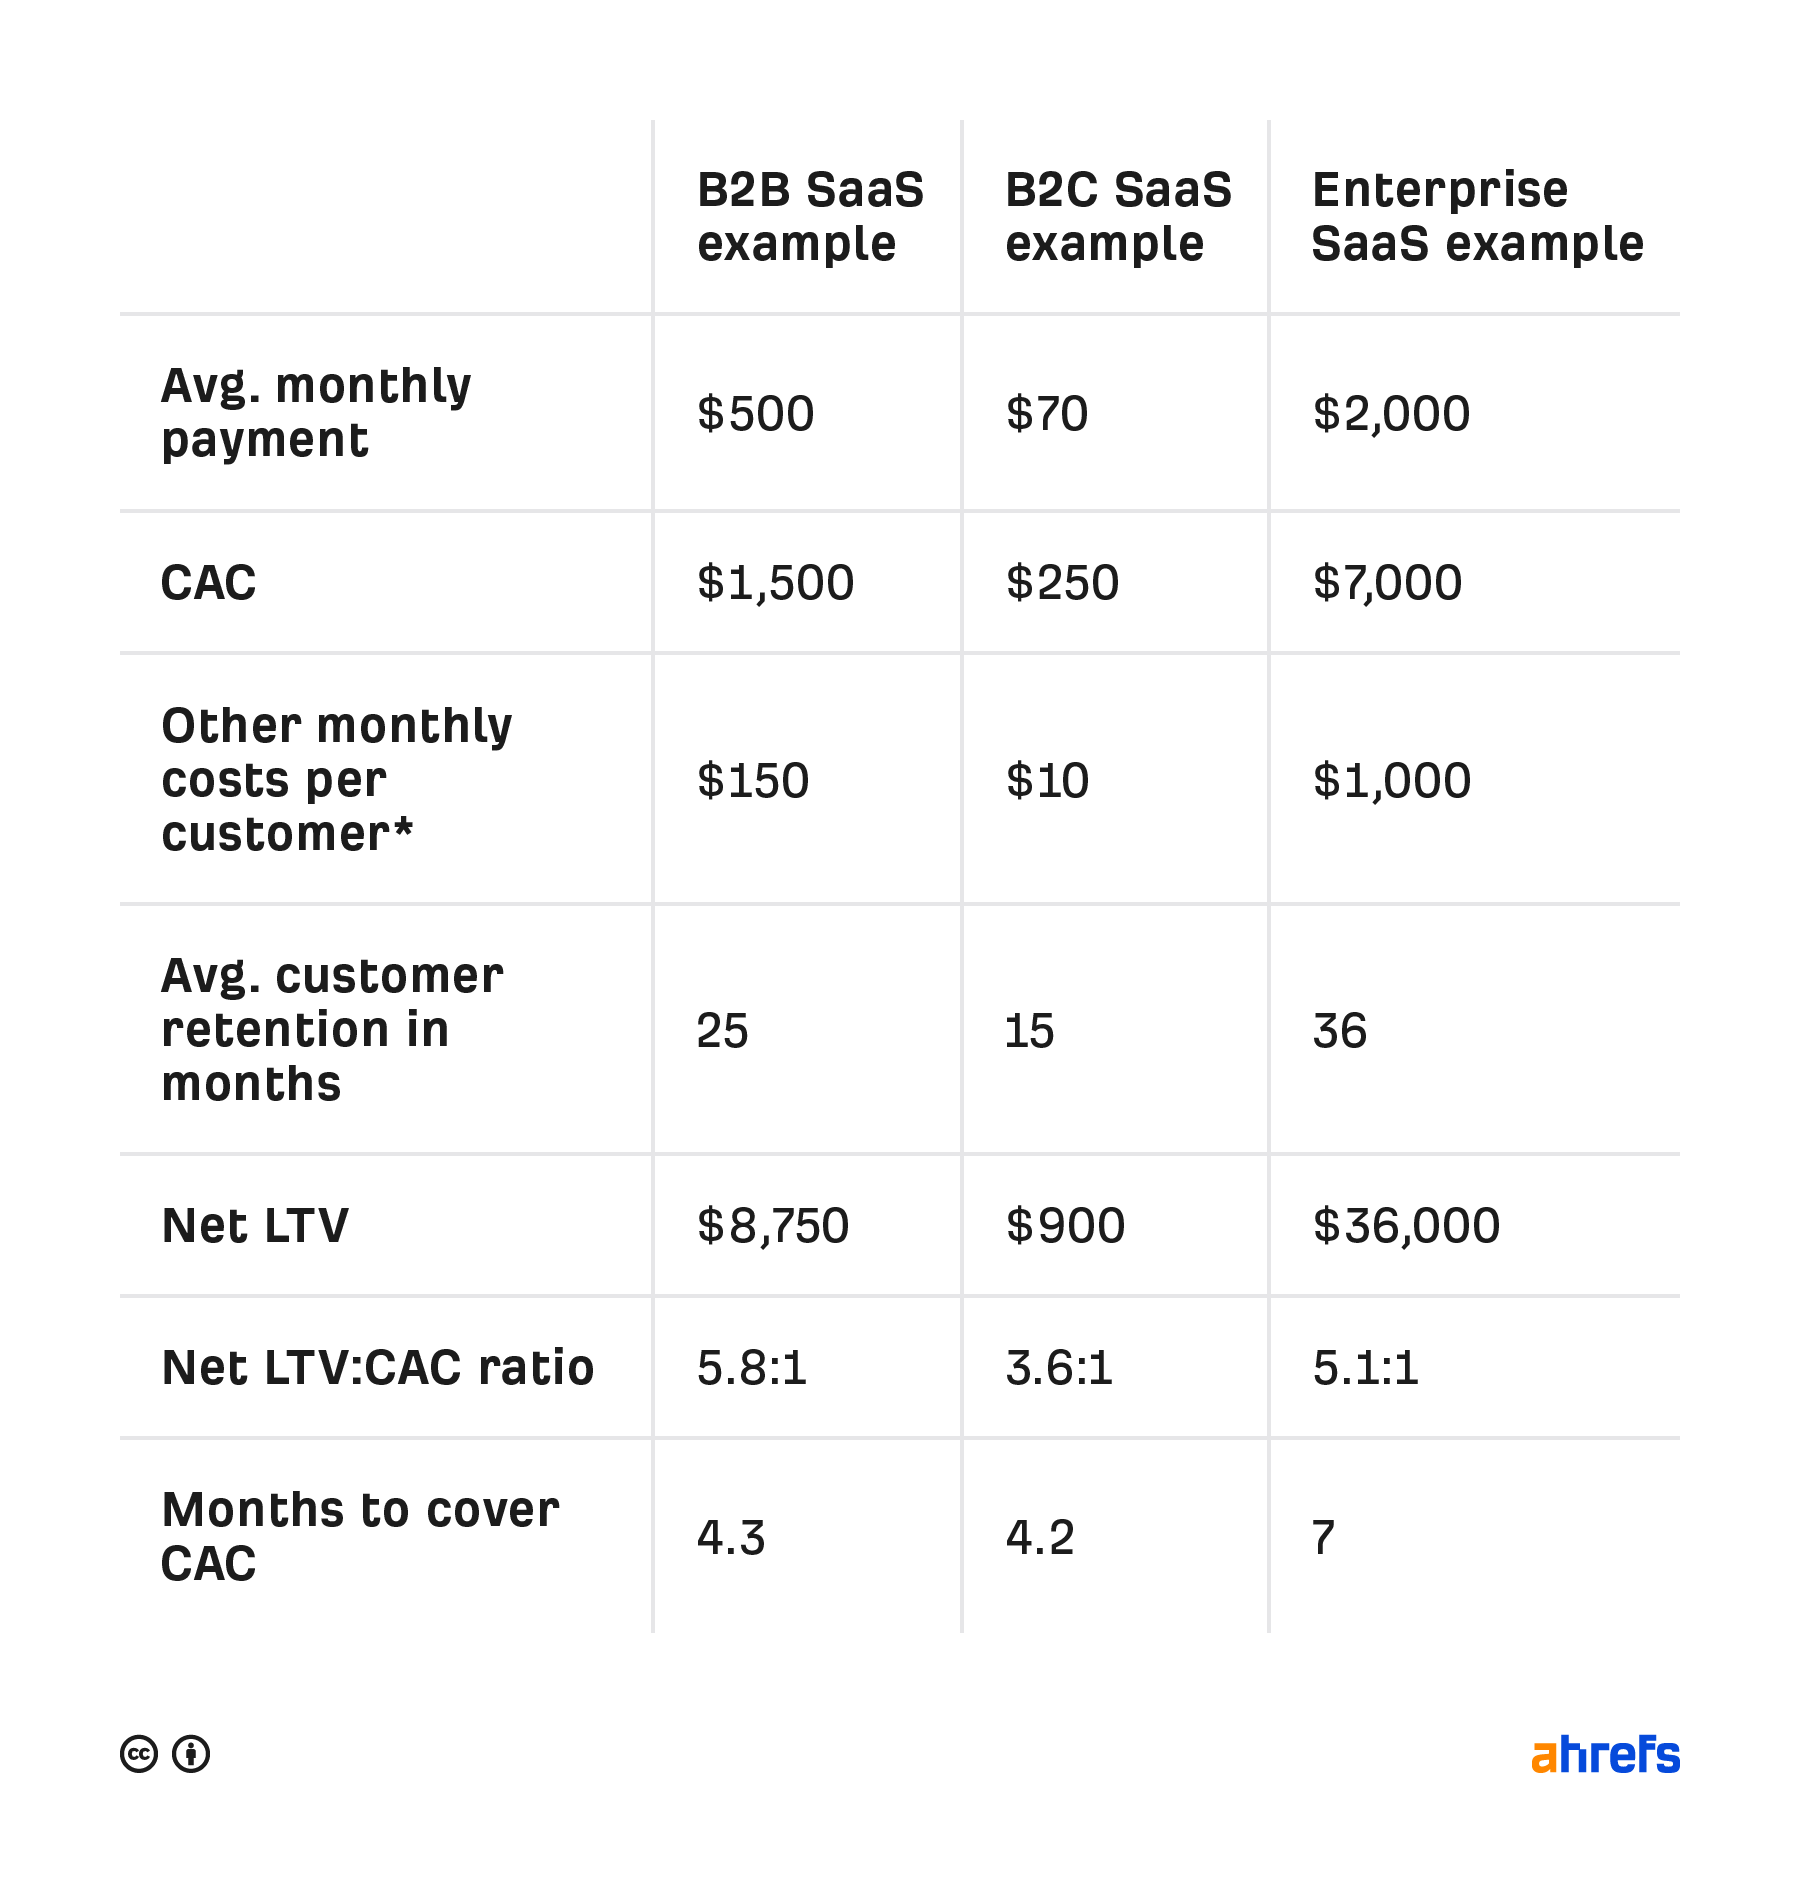
This is one of the most essential eCommerce metrics for managing your budget, improving ROI, and scaling your store profitably. Knowing your CAC helps you understand if your marketing strategy is cost-effective. When you compare it with metrics like Customer Lifetime Value (CLV), you can see whether you're gaining or losing money over the long term. A high CAC with a low CLV means you're overspending to get customers who won’t stick around.
You can calculate customer acquisition cost using this formula:
Customer Acquisition Cost = Total Marketing and Sales Costs / Number of New Customers Acquired
11. Returning customer rate
Returning customer rate is the percentage of customers who come back to make a second purchase (or more) after their first order. It reflects how loyal your customers are and how strong your customer retention efforts are.
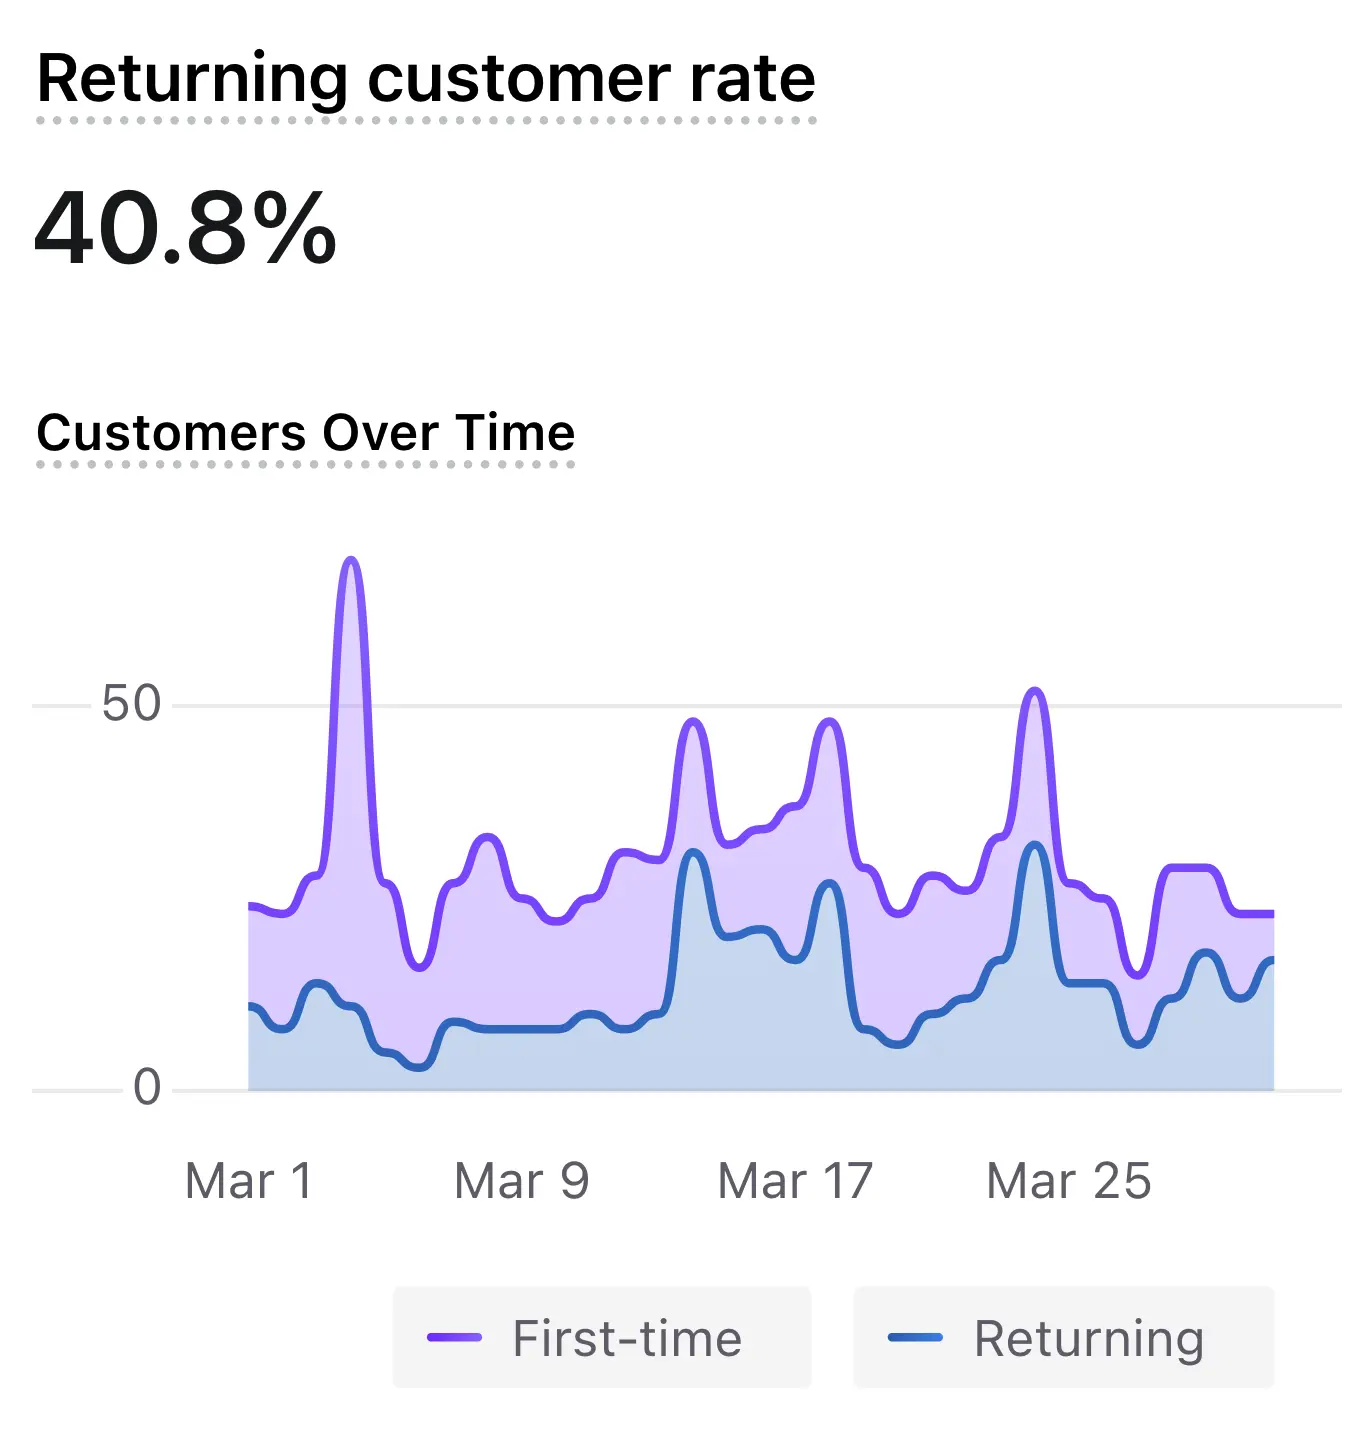
As one of the most insightful eCommerce metrics for long-term growth, this rate helps you evaluate your post-purchase strategy, loyalty programs, and customer experience. A healthy returning customer rate means your store is building trust and delivering value that brings people back. It also helps improve profitability without needing to constantly invest in new traffic.
To calculate the returning customer rate, use the following formula:
Returning Customer Rate = (Number of Returning Customers / Total Number of Customers) × 100
12. Customer retention rate
Customer retention rate is the percentage of customers who continue to buy from your store over a specific period. It shows how successful you are at building lasting relationships and keeping customers engaged after their first purchase.
Retaining existing customers is often more cost-effective than acquiring new ones. A strong retention rate means your store delivers good value, consistent service, and a positive experience that makes people return. This metric is key for predicting future revenue, optimizing email and loyalty campaigns, and increasing customer lifetime value.
To calculate the customer retention rate, use the following formula:
Customer Retention Rate = [(Customers at End of Period - New Customers During Period) / Customers at Start of Period] × 100
13. Churn rate
Churn rate measures the percentage of customers who stop buying from your store within a given period. It’s the opposite of your retention rate and is most relevant for subscription-based or repeat-purchase businesses.
As one of the more critical eCommerce metrics for retention-focused strategies, churn rate helps you understand what’s driving customer loss and how to stop it. A high churn rate can signal poor customer experience, lack of engagement, or problems with your product or service. By tracking this metric, you can identify when and why customers leave, giving you the opportunity to improve communication, offer incentives, or refine your product strategy. Reducing churn directly increases customer lifetime value and long-term revenue.
To calculate churn rate, use the following formula:
Churn Rate = (Customers Lost During a Period / Customers at the Start of the Period) × 100
14. Net promoter score
Net Promoter Score is a metric that gauges how likely customers are to recommend your store to others. It’s based on a single question: “On a scale of 0 to 10, how likely are you to recommend us to a friend or colleague?” Customers are grouped into three categories: Promoters (9-10), Passives (7-8), and Detractors (0-6).
Among experience-focused eCommerce metrics, NPS stands out as a quick and clear way to understand how customers feel about your brand since it gives you insight into how satisfied and loyal your customers really are. A high score means people love your brand and are more likely to promote it organically, while a low score can signal deeper problems with your product, service, or shopping experience. This metric helps you improve customer experience, build loyalty, and spot issues early before they turn into churn.
To calculate Net Promoter Score, use the following formula:
NPS = % of Promoters – % of Detractors
Digital marketing metrics
15. Total traffic
Total traffic refers to the overall number of visitors your online store receives over a specific time period. This includes users coming from all sources, such as search engines, paid ads, social media, email campaigns, and direct visits.
Being one of the foundational eCommerce metrics, total traffic gives you a general view of how visible and accessible your store is online. An increase in traffic often means your marketing and SEO efforts are working, while a sudden drop could indicate technical issues or poor campaign performance. While traffic alone doesn’t guarantee sales, it’s the first step in converting visitors into customers.
To measure the total traffic your store receives, you can utilize tracking tools like Google Analytics, Ahrefs, SEMrush, or your platform's built-in report function.
16. Impression
Impressions measure the total number of times your website content, product listings, or ads are shown to users, regardless of whether they clicked or engaged. It’s a visibility-focused metric commonly used in paid advertising, social media, and search engine marketing.
Impressions help you gauge the reach of your marketing campaigns and how well your content is being distributed. High impressions mean your brand is getting in front of more people, which is essential for building awareness, especially when launching new products or running promotions. However, impressions should be considered alongside other eCommerce metrics like click-through rate (CTR) or conversion rate to assess overall effectiveness.
To track impressions, you can rely on analytics platforms such as Google Ads, Meta Ads Manager, and other social media insights.
17. Engagement
Engagement refers to the actions visitors take when interacting with your store or marketing content. This includes clicks, likes, shares, comments, time on site, scroll depth, video views, and other behaviors that show interest and involvement.
As one of the most telling eCommerce metrics for content performance, engagement gives you real-time feedback on what’s working and where you can improve user experience. High engagement signals that your content is relevant, valuable, and appealing to your target audience; therefore, tracking engagement helps you improve website content, product pages, and social media campaigns. It also supports better customer relationships and brand loyalty.
To calculate engagement rate for content or campaigns, you can use the following formula:
Engagement Rate = (Total Engagements / Total Impressions) × 100
18. Click-through rate
Click-through rate is the percentage of people who clicked on a link, ad, or button after seeing it. This could apply to email campaigns, paid search ads, social media posts, or even internal website banners.
CTR shows how compelling your message, design, or offer is to your audience. A high CTR means your content is relevant and engaging, while a low CTR may indicate weak headlines, poor targeting, or mismatched audience expectations. This metric helps you optimize marketing efforts and improve the performance of traffic-driving channels.
To calculate click-through rate, use the following formula:
Click-Through Rate = (Total Clicks / Total Impressions) × 100
19. Email subscription rate
Email subscription rate is the percentage of website visitors who sign up for your email list during a specific period. These sign-ups usually happen through popups, embedded forms, checkout opt-ins, or gated content.
Among other lead generation–focused eCommerce metrics, this one helps you understand how well your store captures interest and builds future revenue opportunities through email marketing. A growing list means you can reach more potential customers directly, promote products, recover abandoned carts, and build long-term relationships. A low subscription rate may suggest weak lead magnets, poor form placement, or a lack of incentive.
To calculate the email subscription rate, use the following formula:
Email Subscription Rate = (Number of New Subscribers / Total Website Visitors) × 100
20. Return on ad spend (ROAS)
ROAS tells you how much revenue you earn for every dollar spent on advertising. It shows the direct return your business gets from its investment in platforms like Google Ads, Facebook Ads, TikTok Ads, and more.
ROAS is one of the most important eCommerce metrics for assessing ad performance. A high ROAS means your ads are generating strong returns, while a low ROAS may indicate poor targeting, ineffective creatives, or high acquisition costs. This metric helps you decide which campaigns to scale, pause, or improve, so you can make smarter budget decisions and improve profitability.
You can use the following formula to calculate ROAS:
ROAS = Revenue from Ads / Cost of Ads
21. Bounce rate
Bounce rate is the percentage of visitors who land on your website and leave without clicking on anything or visiting another page. It indicates how engaging or relevant your landing pages are to your audience.
A high bounce rate often means that visitors aren’t finding what they expected, or they’re losing interest quickly due to slow loading speed, poor layout, or weak content. Monitoring this eCommerce metric helps you identify pages that may be underperforming and need improvement. Reducing bounce rate can lead to higher engagement, more conversions, and better SEO performance.
To calculate bounce rate, use the following formula:
Bounce Rate = (Single-Page Sessions / Total Sessions) × 100
How to Choose the Right eCommerce Metrics for Your Online Store
With so many eCommerce metrics available, it’s easy to feel overwhelmed. However, not all metrics are equally useful for every business. To make the most of your data, you need to focus on the metrics that align with your goals, business model, and growth stage.
Here are some steps to help you choose the right metrics:
- Start with your business goals: Define what you want to achieve, whether it's increasing sales, reducing churn, boosting traffic, or improving customer retention. Your goals should guide which metrics to prioritize.
- Match goals with relevant metrics: For example, if you're focused on growth, track customer acquisition cost (CAC), traffic, and conversion rate. If you're aiming for profitability, focus on average order value (AOV), customer lifetime value (CLV), and return on ad spend (ROAS).
- Avoid vanity metrics: Metrics like impressions or page views might look impressive but don’t always reflect business success. Choose metrics that lead to meaningful action and measurable outcomes.
- Keep your dashboard focused: Instead of tracking every number, select 5–10 core metrics that give you a clear snapshot of your store’s performance. This keeps reporting simple and actionable.
- Adjust based on your store’s stage: A new store might focus on acquisition and traffic, while an established store should prioritize retention, efficiency, and long-term value.
By selecting the right eCommerce metrics, you can make smarter decisions, stay focused on your goals, and grow your online store with clarity and confidence.
eCommerce Metrics – FAQs
What are metrics in eCommerce?
Metrics in eCommerce are measurable data points that help you track the performance of your online store. These can include sales figures, website traffic, conversion rates, return rates, and more. They offer insights into how your business is doing across different areas like marketing, sales, customer service, and operations.
What is a KPI in eCommerce?
A KPI (Key Performance Indicator) in eCommerce is a specific metric that directly reflects your business goals. Unlike general metrics, KPIs are tied to targets and help you evaluate whether you’re on track to achieve those goals. For example, if your goal is to grow customer loyalty, returning customer rate might be one of your KPIs.
What are the differences between eCommerce metrics and KPIs?
While all KPIs are metrics, not all metrics are KPIs. eCommerce metrics provide broad data about your store’s performance, but KPIs focus only on the numbers that align with your business objectives. Metrics help you observe trends and activity, while KPIs help you measure success against specific goals.
Final Words
In short, tracking the right eCommerce metrics is one of the most effective ways to grow your online business with confidence. These metrics give you a deeper understanding of how your store is performing, where your opportunities lie, and what actions you need to take next. From sales and customer retention to marketing performance and engagement, each metric plays a role in shaping your strategy. But remember, it’s not about tracking everything. It’s about focusing on the numbers that truly reflect your goals.